wenmo8 发布的文章

使用Microsoft Visual Studio 进行调试时,在打开托管调试的情况下从.NET项目进行调试时,您可能会受到各种不真正关心的异常的困扰。以下是如何设置你的环境来忽略那些愚蠢的东西,并保留好的东西。


具体内容:

  1. 勾选(在方框中打勾)两列中的所有类别。
  2. 选中然后取消选中托管调试助手以强制取消选中所有子项。
  3. 使用Add按钮,将C++(Exchange)、EEFileLoadExceptionHRException添加到C++异常类别中。取消选中它们。

使用纯本机调试器调试.NET应用程序时要忽略的其他一些异常:

  • C++ Exceptions
  • EEMessageException
  • Win32 Exceptions
  • 4242420 CLRDBG_NOTIFICATION_EXCEPTION_CODE
  • e0434352 CLR Exception

如果您像我一样,您可能会忘记需要查找某些特定信息的类和名称空间。或者你忘了要查找的字段名。例如当我需要从System.Data.SqlClient命名空间查找信息。
此脚本从连接检索特定信息。扩展它也很容易,因此可以使用相同的方法从其他名称空间和字段中提取信息。
就个人而言,我更喜欢基于DML(调试标记语言)的方法,因为我可以使用超链接和默认脚本调用:$$><。DML方法需要更多的工作和更低级的编程,但是可以提供更好的结果。

需要使用$$<而不是$$><。


Source code for CONNECTIONS_POOL.TXT:

$$

$$ =============================================================================

$$ Verify Connections from Pool.

$$

$$ Compatilibity: Win32, should work on Win64.

$$

$$ Attention! For .Net Framework 2.0, edit the script and remove the clr10\\ from it so it can use the

$$ sos.dll version 2.0

$$

$$ Usage: $$< to run the script. (note: Just $$< not $$><)

$$

$$ Requirements: Public symbols.

$$

$$ Roberto Alexis Farah


$$ All my scripts are provided "AS IS" with no warranties, and confer no rights.

$$ =============================================================================

$$

.shell -i - -ci ".foreach ( obj {!clr10\\sos.dumpheap -type System.Data.SqlClient.SqlInternalConnection -short} ) {!do ${obj} }" FIND "_fInPool"

.shell -i - -ci ".foreach ( obj {!clr10\\sos.dumpheap -type System.Data.SqlClient.SqlConnectionPoolControl -short} ) {!do ${obj} }" FIND "_fResetConnection"

.shell -i - -ci ".foreach ( obj {!clr10\\sos.dumpheap -type System.Data.SqlClient.SqlConnectionPoolControl -short} ) {!do ${obj} }" FIND "_maxPool"

$$

$$ Number of Connection Objects

$$ ============================

$$

!clr10\\sos.dumpheap -type System.Data.OleDb.OleDbConnection -stat

$$

$$ ===================================================================

Windbg有很多命令和命令变体,因此有时您可能会忘记其中的一些命令,比如当您需要挖掘调用堆栈以提取更多信息时。或者您可能记得获取调用堆栈详细信息的命令,但您需要确保获得整个堆栈。或者,您可能需要一种快速挖掘堆栈的方法,首先从帧中获取信息,然后从局部变量获取信息,而无需花费太多时间键入命令或使用箭头键。
如果你在下面场景中看到你自己需要的,这个脚本就是为你准备的!

此脚本使您能够从调用堆栈快速获取以下信息:

  • ANSI字符串。
  • Unicode字符串。
  • 符号。
  • 指针引用。
  • 帧局部变量。(需要专用符号)

界面非常简单,可能不太漂亮。下面是两个截图,让您了解:


Source code - DIG_STACK.TXT:

$$

$$ =============================================================================

$$ Dig information from the current call stack:

$$ - Unicode Strings

$$ - ANSI Strings

$$ - Symbols

$$ - Pointer references

$$ - Local variables by frames

$$

$$ Compatibility: Win32, should work on Win64.

$$

$$ Usage: $$>< to run the script.

$$

$$ If necessary change the filename below to include your path and filename.

$$ By default it uses the WinDbg path and the default file name is DIG_STACK.TXT

$$

$$ Roberto Alexis Farah

$$ Blog: http://blogs.msdn.com/debuggingtoolbox/

$$

$$ All my scripts are provided "AS IS" with no warranties, and confer no rights.

$$ =============================================================================

$$

.block

{

as ${/v:ScriptName} MYSCRIPTS\\DIG_STACK.txt

}

.block

{

.printf /D "<link cmd=\"dpu @$csp poi(@$teb+0x4);ad ${/v:ScriptName}; $$><${ScriptName}\"><b>Unicode Strings</b></link>\n\n"

.printf /D "<link cmd=\"dpa @$csp poi(@$teb+0x4);ad ${/v:ScriptName}; $$><${ScriptName}\"><b>ANSI Strings</b></link>\n\n"

.printf /D "<link cmd=\"dps @$csp poi(@$teb+0x4);ad ${/v:ScriptName}; $$><${ScriptName}\"><b>Symbols</b></link>\n\n"

.printf /D "<link cmd=\"dpp @$csp poi(@$teb+0x4);ad ${/v:ScriptName}; $$><${ScriptName}\"><b>Pointer References</b></link>\n\n"

.printf /D "<link cmd=\"kpM 2000;ad ${/v:ScriptName}; $$><${ScriptName}\"><b>Local Variables by Frames</b></link>\n"

}

$$ ===========================================================================

好的,假如正在调试一个.NET应用程序。您需要找出从访问数据库的线程执行的查询和存储过程,但是您不知道如何。好消息!这已经不是问题了!此脚本显示与SQLCommand或OracleCommand对象关联的所有查询或存储过程。此外,您可以单击它以获取更多详细信息和使用它的线程。。
以下是截图:

 Source code for GET_SQLCOMMAND.TXT:

$

$$

$$ =============================================================================

$$ It shows the SQL commands from a .NET application. It gives you detailed information

$$ and the threads using the query/stored procedure you selected.

$$ Useful for Oracle and SQL Server.

$$

$$ Compatibility: Win32.

$$

$$ Usage: Use $$>< to run the program.

$$

$$ Requirements: Public symbols.

$$

$$ If necessary change the filename below to include your path and filename.

$$ By default it uses the WinDbg path and the default file name is GET_SQLCOMMAND.TXT

$$

$$ Roberto Alexis Farah

$$ Blog: http://blogs.msdn.com/debuggingtoolbox/

$$

$$ All my scripts are provided "AS IS" with no warranties, and confer no rights.

$$ =============================================================================

$$

ad /q *

r @$t0 = 0

r @$t1 = 0

.printf /D "<b>\nClick on the queries/stored procedures below to get more details and to find out the threads using it.\n\n</b>"

.block

{

    .block

    {

        as ${/v:ScriptName} MYSCRIPTS\\GET_SQLCOMMAND.TXT

    }

    .block

    {

        as SQLCommand .block

        {

            !DumpObj poi(@$t0+0x10)

            !DumpObj @$t0

            !GCRoot @$t0

        }

    }

    .block

    {

        as OracleCommand .block

        {

            !DumpObj poi(@$t0+0x14)

            !DumpObj @$t0

            !GCRoot @$t0

        }

    }

}

.foreach(obj {!dumpheap -short -type System.Data.SqlClient.SqlCommand } )

{

    r @$t1 = 1

    .printf /D "<link cmd=\"r @$t0 = ${obj}; ${SQLCommand} ;ad ${/v:ScriptName}; $$><${ScriptName}\"><b>%mu</b></link>\n\n", poi(${obj}+0x10)+0xc

}

.foreach(obj {!dumpheap -short -type System.Data.OracleClient.OracleCommand } )

{

    r @$t1 = 1

    .printf /D "<link cmd=\"r @$t0 = ${obj}; ${OracleCommand} ;ad ${/v:ScriptName}; $$><${ScriptName}\"><b>%mu</b></link>\n\n", poi(${obj}+0x14)+0xc

}

.if(0 = @$t1)

{

    .printf /D "<b>\nNo SQL commands found.\n</b>"

}

在过去,我研究了一个支持案例,我需要找出C++应用程序中的一些消息框是否被显示,如果是肯定的,消息是什么。每次我问用户时得到的回答都不一致,所以我不知道是否出现了MessageBox或消息是什么。
这听起来像是另一个完美的场景,脚本可能会有所帮助!事实上,这对我帮助很大,我希望对你也有帮助。这个脚本映射MessageBox调用,并将消息从MessageBox记录到Windbg屏幕上,也记录到一个文本文件中。
调试应用程序后,应使用“.logclose”关闭日志。然后您可以搜索字符串“Text from MessageBox”,您将得到应用程序显示的所有MessageBox!
你可以用DBMon.exe或者DebugView.exe查看来自MessageBox窗口的消息。我从来没有在.NET应用程序上测试过它,但它应该可以工作,因为MessageBox是在一些.NET Framework调用的幕后调用。
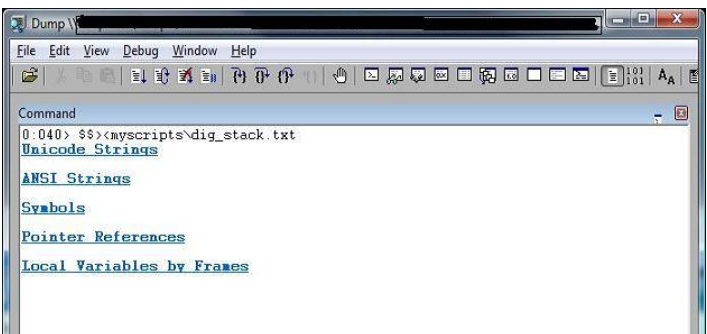
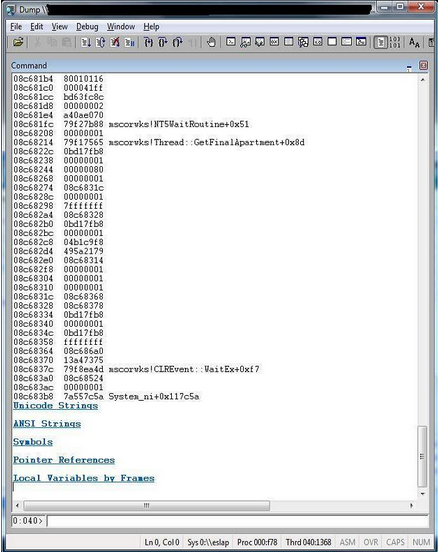
截图如下:


 注意!在上面的命令后按两次回车键而不是一次。


 Source code for MSGBOX_TRACING.TXT:

$$

$$ =============================================================================

$$ Log MessageBox messages in a log file.

$$ The log file name starts with MessageBox string.

$$

$$ Compatibility: Win32.

$$

$$ Usage: $$>< to run the script.

$$

$$ Requirements: Public symbols.

$$

$$ Roberto Alexis Farah

$$ Blog: http://blogs.msdn.com/debuggingtoolbox/

$$

$$ All my scripts are provided "AS IS" with no warranties, and confer no rights.

$$ =============================================================================

$$

$$ This location 7EEEEEEE is difficult to be used but

$$ it could be occupied!!!

$$

.dvalloc /b 0x7EEEEEEE 0x400

r @$t0 = 0x7EEEEEEE

eb 0x7EEEEEEE 50

bp user32!MessageBoxExW "r @$t1 = @eip; r @eax = poi(@esp + 0x8); r @eip = @$t0;g"

bp @$t0 + 0x6 ".echo <-- Text from MessageBox; r @$ip = @$t1;g"

.logopen /t /u MessageBox.txt

.printf /D "\nType <b>call kernel32!OutputDebugStringW</b> then press Enter key two times then 'g' command after it.\n"

a 0x7EEEEEEF

$$

$$ ATTENTION! Use .logclose after finishing the debugging session.

$$

$$ =========================

Note: Some of my previous scripts were updated! Whenever I do that I write a small comment about it explaining the update.