如何用Python对股票数据进行LSTM神经网络和XGboost机器学习预测分析(附源码和详细步骤),学会的小伙伴们说不定就成为炒股专家一夜暴富了
前言
最近调研了一下我做的项目受欢迎程度,大数据分析方向竟然排第一,尤其是这两年受疫情影响,大家都非常担心自家公司裁员或倒闭,都想着有没有其他副业搞搞或者炒炒股、投资点理财产品,未雨绸缪,所以不少小伙伴要求我这边分享下关于股票预测分析的技巧。
基于股票数据是一个和时间序列相关的大数据,所以我打算给大家分享时下最受欢迎的时序模型:
LSTM、XGBoost两大经典模型
。
@
一、模型简介
1.1 LSTM神经网络模型
根据
百度百科定义
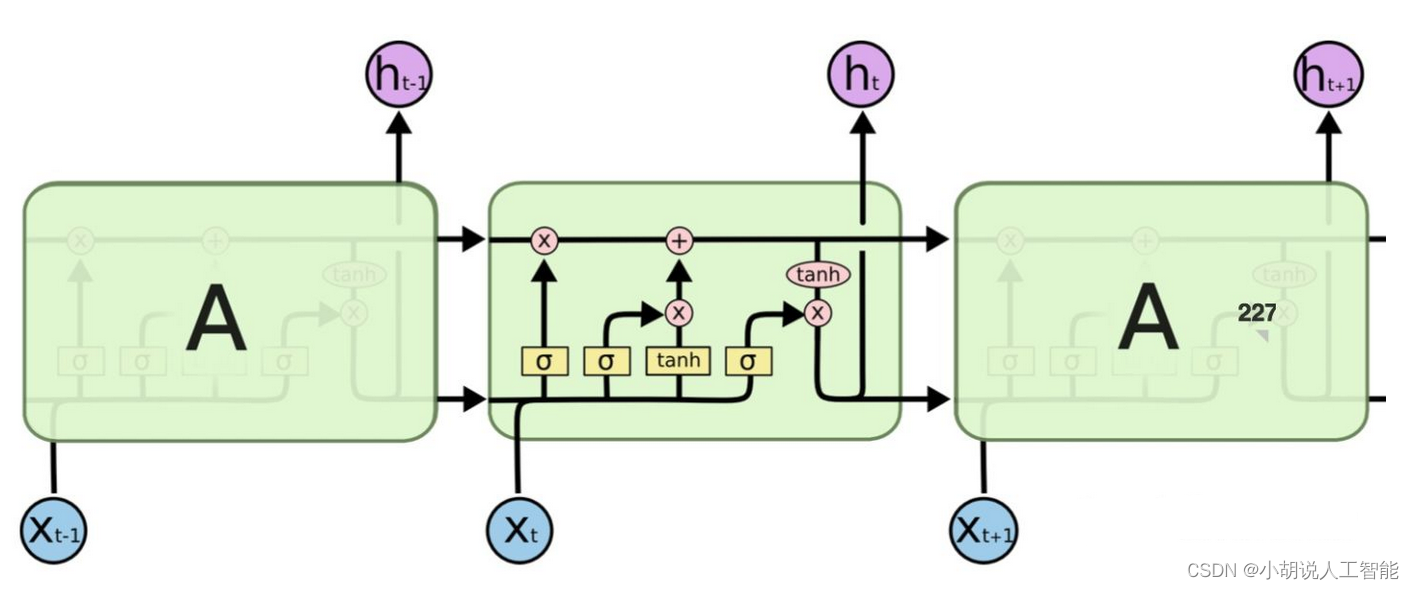
:长短期记忆网络(LSTM,Long Short-Term Memory)是一种时间循环神经网络,是为了解决一般的RNN(循环神经网络)存在的长期依赖问题而专门设计出来的,所有的RNN都具有一种重复神经网络模块的链式形式。在标准RNN中,这个重复的结构模块只有一个非常简单的结构,例如一个tanh层。
LSTM 能够进行一次多步预测,对于时间序列预测有一定的参考价值。LSTM的难点在于配置不方便。

1.2 XGBoost机器学习模型
XGBoost全称是eXtreme Gradient Boosting,根据
百度百科定义
:XGBoost是一个优化的分布式梯度增强库,旨在实现高效,灵活和便携。它在 Gradient Boosting 框架下实现机器学习算法。XGBoost提供并行树提升(也称为GBDT,GBM),可以快速准确地解决许多数据科学问题。相同的代码在主要的分布式环境(Hadoop,SGE,MPI)上运行,并且可以解决数十亿个示例之外的问题。
可能大家光看定义,不能太理解XGBoost的牛逼之处,了解过Kaggle竞赛的小伙伴应该知道,由于XGBoost 库专注于计算速度和模型性能,因此几乎没有多余的装饰,算法的实现也旨在提高计算时间和内存资源的效率,所以它目前已经在 Kaggle 竞赛数据科学平台上成为竞赛获胜者的首选算法。
例如,有一个不完整的一、二、三等奖获奖名单,标题为: XGBoost: Machine Learning Challenge Winning Solutions。
为了使这一点更加具体,以下是 Kaggle 竞赛获胜者的一些有见地的引述:
作为越来越多的 Kaggle 比赛的获胜者,XGBoost 再次向我们展示了它是一种出色的全能算法。
——拿督优胜者访谈:第一名,疯狂教授
如有疑问,请使用 xgboost。
— Avito 优胜者访谈:第一名,Owen Zhang
我喜欢表现良好的单个模型,我最好的单个模型是 XGBoost,它可以单独获得第 10 名。
—卡特彼勒获奖者访谈:第一名
我只用过 XGBoost。
— Liberty Mutual Property Inspection,优胜者访谈:第一名,王清臣
我使用的唯一监督学习方法是梯度提升,在优秀的 xgboost 中实现。
— Recruit Coupon Purchase 优胜者访谈:第二名,Halla Yang
同时XGBoost 是免费的开源软件,可在 Apache-2 许可下使用,尤其是支持多种接口,如命令行界面 (CLI)、C++(编写库的语言)、Python 接口以及 scikit-learn 中的模型、R 接口以及 caret 包中的模型、Julia、Java 和 JVM 语言(如 Scala)和平台(如 Hadoop)。所以它应用得也越来越广泛,它也是我学习监督机器学习的最重要算法。
关于它的原理实现,我这就不详细介绍了,这篇主要是讲其应用,感兴趣的小伙伴们可以自己搜索学习下,当然你也可以登录它的
github地址
来详细学习。
二、项目详细介绍
任何一个大数据分析项目,我觉得都应该先了解清楚项目目的,在做分析,所以我们先来简单明确下本次项目的主要目的:
项目目的
本次项目是使用LSTM神经网络模型、XGBoost模型,来对股票数据中的某个关键价格,进行预测分析。数据来源,搜狐财经中的某个可转债Zclose相关数据。
下面我就按照大数据分析的一般步骤给大家演示下具体项目实现过程,该分析步骤基本适用于大部分数据分析流程,觉得有用的小伙伴们可以收藏关注哈。
2.1 导入数据
主要使用Pandas库进行数据导入
import pandas as pd # data processing, CSV file I/O (e.g. pd.read_csv)

all_data_set_path = r'csv_export\csv_data_1m_begin_40d_博22转债_SHSE.113650_SHSE.603916.csv'
all_data_set = pd.read_csv(all_data_set_path)
print(all_data_set.head())
print(all_data_set.info()) #查看有多少数据及特征
print(all_data_set.isnull().sum()) #检查是否有空数据


2.2 研究数据
主要使用matplotlib库对数据进行初步特征研究分析
import matplotlib.pyplot as plt
plt.style.use('fivethirtyeight')

# 特征热力图 相关性分析
list_columns = all_data_set.columns
plt.figure(figsize=(15,10))
sns.heatmap(all_data_set[list_columns].corr(), annot=True, fmt=".2f")
plt.show()

从热力图可以大概看出,与zclose相关性比较高的几个特征,接下来就是对特征重要性进行排序,选择出相关性较高的特征。可以看出zlow、zhigh、zopen与zclose特征的相关性最高,都达到了98%左右,所以我们可以优先选取这3个特征,进行分析。
# 对特征重要性进行排序
corr_1 = all_data_set.corr()
corr_1["zclose"].sort_values(ascending=False)

2.3 数据预处理
数据预处理是整个数据分析过程中最重要的一个步骤,都说"
数据和特征决定了机器学习的上限,而模型和算法只是逼近这个上限而已
"。如果数据和关键特征处理的好,使用不同的模型和算法,都可以取得比较好的效果。
而且数据预处理往往要占整个数据分析的大部分时间,有些甚至占到80%-90%的时间。所以想深入学习大数据分析的小伙伴们,要熟练掌握各种数据预处理的方法哈,比如常用的空值、缺失值、异常值处理、数据不平衡处理、特征组合等等。
由于未来股票受近期股票价格波动的影响较大,所以为了能充分利用近期的股票数据,博主编写了一个预处理函数,组合历史前几次的数据生成更多的特征来进行预测。这也是时序特征数据的常用方法,大概可以理解为滑动窗口取值吧,具体如下:
len_ = len(['zopen','zhigh','zlow','zclose'])*3
col_numbers_drop = []
for i in range(3):
    col_numbers_drop.append(len_+i)
print(col_numbers_drop)

# 依据特征重要性,选择zlow zhigh zopen来进行预测zclose
# 数据选择t-n, ...., t-2 t-1 与 t 来预测未来 t+1
# 转换原始数据为新的特征列来进行预测,time_window可以用来调试用前几次的数据来预测
def series_to_supervised(data,time_window=3):
    data_columns = ['zopen','zhigh','zlow','zclose']
    data = data[data_columns]  # Note this is important to the important feature choice
    cols, names = list(), list()
    for i in range(time_window, -1, -1):
        # get the data
        cols.append(data.shift(i)) #数据偏移量

        # get the column name
        if ((i-1)<=0):
            suffix = '(t+%d)'%abs(i-1)
        else:
            suffix = '(t-%d)'%(i-1)
        names += [(colname + suffix) for colname in data_columns]

    # concat the cols into one dataframe
    agg = pd.concat(cols,axis=1)
    agg.columns = names
    agg.index = data.index.copy()
    # remove the nan value which is caused by pandas.shift
    agg = agg.dropna(inplace=False)

    # remove unused col (only keep the "close" fied for the t+1 period)
    # Note col "close" place in the columns

    len_ = len(data_columns)*time_window
    col_numbers_drop = []
    for i in range(len(data_columns)-1):
        col_numbers_drop.append(len_+i)

    agg.drop(agg.columns[col_numbers_drop],axis=1,inplace = True)

    return agg

all_data_set2 = all_data_set.copy()
all_data_set2["index"] = pd.to_datetime(all_data_set2["index"])       # 日期object: to datetime
all_data_set2.set_index("index", inplace=True, drop=True) # 把index设为索引

all_data_set2 = all_data_set2[116:] # 这里把7月28日的数据全部删掉了,主要是数据缺失较多

data_set_process = series_to_supervised(all_data_set2,10) #取近10分钟的数据
print(data_set_process.columns.values)

print(data_set_process.info())
到此,我们数据集就生成了,接下来就可以搭建模型,训练模型和预测数据了。
2.4 搭建模型
2.4.1 LSTM神经网络模型
我们可以直接使用Tensorflow 和 Keras中封装好的LSTM模型来进行模型搭建,这里要告诉大家的是,之所以
很多小伙伴都用python来做数据分析
,是因为很多开发者已经用python搭建了各种各样的wheel/package方便大家直接使用。
所以我们就可以直接站在巨人的肩膀上,快速搭建我们需要的各种模型,同时也可以自己对模型进行调参,获取最优参数组合,从而生成一个高精度的数据模型。
这里要注意:LSTM要求数据格式为numpy格式的数组,所以要将pandas的Dataframe数据转换一下,同时LSTM模型对于不同数据范围的特征较为敏感,一般都要进行相同的范围内数据缩放避免预测错误,所以使用了
MinMaxScaler进行缩放数据
。(也可以使用
StandardScaler
)。后面数据预测后,再进行数据逆缩放就可以获得最后结果了。
具体模型搭建如下:
# 注意这里要安装Tensorflow 和 Keras才能使用
from tensorflow.keras.models import Sequential
from tensorflow.keras.layers import Dense, LSTM
from sklearn.preprocessing import MinMaxScaler

scaler = MinMaxScaler(feature_range=(0, 1))
scaled_data = scaler.fit_transform(data_set_process)

# split the train and test data
train_size = int(len(data_set_process) * 0.8)
test_size = len(data_set_process) - train_size
train_LSTM, test_LSTM = scaled_data[0:train_size, :], scaled_data[train_size:len(data_set_process), :]

train_LSTM_X, train_LSTM_Y = train_LSTM[:, :(len(data_set_process.columns) - 1)], train_LSTM[:,
                                                                                  (len(data_set_process.columns) - 1)]
test_LSTM_X, test_LSTM_Y = test_LSTM[:, :(len(data_set_process.columns) - 1)], test_LSTM[:,
                                                                               (len(data_set_process.columns) - 1)]

# reshape input to be [samples, time steps, features]
train_LSTM_X2 = np.reshape(train_LSTM_X, (train_LSTM_X.shape[0], 1, train_LSTM_X.shape[1]))
test_LSTM_X2 = np.reshape(test_LSTM_X, (test_LSTM_X.shape[0], 1, test_LSTM_X.shape[1]))

print(train_LSTM_X.shape, train_LSTM_Y.shape, test_LSTM_X.shape, test_LSTM_Y.shape)
print(train_LSTM_X2.shape, test_LSTM_X2.shape)

# creat and fit the LSTM network
model = Sequential()
model.add(LSTM(50, input_shape=(train_LSTM_X2.shape[1], train_LSTM_X2.shape[2])))
# model.add(LSTM(50))
model.add(Dense(1))
model.compile(loss="mae", optimizer="Adam")
print(model.summary()) #这里是打印模型基本信息

print("start to fit the model")
history = model.fit(train_LSTM_X2, train_LSTM_Y, epochs=50, batch_size=50, validation_data=(test_LSTM_X2, test_LSTM_Y),
                    verbose=2, shuffle=False)

plt.plot(history.history['loss'], label='train')  #可视化模型训练的损失函数
plt.plot(history.history['val_loss'], label='test')
plt.legend()
plt.show()

model.save('LSTM_model.h5')  # 这里保存模型,以便以后可以不用再训练,直接使用

# model的使用
# from tensorflow.keras.models import load_model
# del model  # 删除已存在的model
# model = load_model('LSTM_model.h5')

# make prediction
yPredict = model.predict(test_LSTM_X2) #进行模型预测,注意这里要进行数据逆缩放,获取最后结果,同时注意逆缩放数据时必须与scaler的数据维度保持一致
print(yPredict.shape)
testPredict = scaler.inverse_transform(np.concatenate((test_LSTM_X, yPredict), axis=1))[:, -1:]


2.4.2 XGBoost模型搭建
XGBoost的模型可以说是非常成熟了,我们可以直接安装xgboost库来搭建模型,博主选了一组初始参数进行模型训练,小伙伴们也可以使用网格搜索GridSearchCV()或者随机搜索RandomizedSearchCV()来进行参数调优操作,具体如下:
import xgboost as xgb
from xgboost import plot_importance, plot_tree

train_size = int(len(data_set_process)*0.8)
test_size = len(data_set_process) - train_size
train_XGB, test_XGB = scaled_data[0:train_size,:],scaled_data[train_size:len(data_set_process),:]

train_XGB_X, train_XGB_Y = train_XGB[:,:(len(data_set_process.columns)-1)],train_XGB[:,(len(data_set_process.columns)-1)]
test_XGB_X, test_XGB_Y = test_XGB[:,:(len(data_set_process.columns)-1)],test_XGB[:,(len(data_set_process.columns)-1)]

# 算法参数
params = {
    'booster':'gbtree',
    'objective':'binary:logistic',  # 此处为回归预测,这里如果改成multi:softmax 则可以进行多分类
    'gamma':0.1,
    'max_depth':5,
    'lambda':3,
    'subsample':0.7,
    'colsample_bytree':0.7,
    'min_child_weight':3,
    'slient':1,
    'eta':0.1,
    'seed':1000,
    'nthread':4,
}

#生成数据集格式
xgb_train = xgb.DMatrix(train_XGB_X,label = train_XGB_Y)
xgb_test = xgb.DMatrix(test_XGB_X,label = test_XGB_Y)
num_rounds = 300
watchlist = [(xgb_test,'eval'),(xgb_train,'train')]

#xgboost模型训练
model_xgb = xgb.train(params,xgb_train,num_rounds,watchlist)

#对测试集进行预测
y_pred_xgb = model_xgb.predict(xgb_test)
2.5 数据可视化及评估
数据可视化就相对简单了,类似于我们用excel来生成各种图表,直观地来看数据分布情况。
除了对数据直观展示外,我们也常使用MAPE、MAE、RMSE、R2对数据预测结果准确性进行评估,这里我就简单使用了MAPE(平均绝对误差率)给大家演示,其中LSTM模型下的测试集、训练集的MAPE都在0.07%之内,也就是说准确率在99.9%以上,可以说效果很好了。XGBoost模型的测试集MAPE在1.2%之内,也就是说准确率在98.8%左右,也可以说效果不错。
具体LSTM模型结果可视化及评估如下:
# make prediction
yPredict = model.predict(test_LSTM_X2)
print(yPredict.shape)

testPredict = scaler.inverse_transform(np.concatenate((test_LSTM_X, yPredict), axis=1))[:, -1:]
test_LSTM_Y2 = scaler.inverse_transform(np.concatenate((test_LSTM_X, test_LSTM_Y.reshape(len(test_LSTM_Y),1)), axis=1))[:, -1:]
print(testPredict.shape)
# print(testPredict)

print("start calculate the mape")

mape = np.mean(np.abs(test_LSTM_Y2.flatten()-testPredict.flatten())/test_LSTM_Y2.flatten())*100  # 这里计算测试集预测结果与真实结果的误差率
print('Test LSTM for test set Score:%.6f MAPE' %(mape)) #0.027897%的误差

yPredict_train = model.predict(train_LSTM_X2)
print(yPredict_train.shape)
print(train_LSTM_X2.shape)
trainPredict = scaler.inverse_transform(np.concatenate((train_LSTM_X, yPredict_train), axis=1))[:, -1:]
train_LSTM_Y2 = scaler.inverse_transform(np.concatenate((train_LSTM_X, train_LSTM_Y.reshape(len(train_LSTM_Y),1)), axis=1))[:, -1:]

print("start calculate the mape2")

mape2 = np.mean(np.abs(train_LSTM_Y2.flatten()-trainPredict.flatten())/train_LSTM_Y2.flatten())*100  # 这里计算训练集预测结果与真实结果的误差率
print('Test LSTM for train set Score:%.6f MAPE' %(mape2))  #0.068852%的误差

plt.plot(train_LSTM_Y2, color = 'red', label = 'Real Price for Train set')
plt.plot(trainPredict, color = 'blue', label = 'Predicted Price for Train set')
plt.title('Zclose Price Prediction for Train set')
plt.xlabel('Time')
plt.ylabel('Sohu Zclose Price')
plt.legend()
plt.show()

plt.plot(test_LSTM_Y2, color = 'red', label = 'Real Price for Test set')
plt.plot(testPredict, color = 'blue', label = 'Predicted Price for Test set')
plt.title('Zclose Price Prediction for Test set')
plt.xlabel('Time')
plt.ylabel('Sohu Zclose Price')
plt.legend()
plt.show()


具体XGBoost模型结果可视化及评估如下:
plt.plot(test_XGB_Y, color = 'red', label = 'Real Price for Test set')
plt.plot(y_pred_xgb, color = 'blue', label = 'Predicted Price for Test set')
plt.title('Zclose Price Prediction for Test set')
plt.xlabel('Time')
plt.ylabel('Sohu Zclose Price')
plt.legend()
plt.show()

mape_xgb = np.mean(np.abs(y_pred_xgb-test_XGB_Y)/test_XGB_Y)*100
print('XGBoost平均误差率为:{}%'.format(mape_xgb))  #平均误差率为1.1974%
代码
所有数据集、代码都已经上传到
我的github
,欢迎大家前往fork、下载。
建议
博主有位朋友在大的金融公司专门做量化投资的,他尝试过加入各种相关因子、特征,使用不同的模型,调参来获取最高的准确度,但由于股票、债券、基金这些金融产品都受各种政治、经济、社会等综合因素的影响,经常会有突发情况导致预测出现较大波动。最后他发现,最好的方法是在每天晚上利用当天的数据重新来训练下,往往能获取到最好的模型。
所以说想尝试往量化投资、机器学习大数据分析这块发展的话,一定要根据实际情况,不断地根据最新的数据,去
实时更新自己的模型
,才能获取到最好的效果。当然也奉劝大家常年不变的真理:
金融有风险,投资需谨慎
。
如果大家想继续了解人工智能相关
学习路线和知识体系
,欢迎大家翻阅我的另外一篇博客
《重磅 | 完备的人工智能AI 学习——基础知识学习路线,所有资料免关注免套路直接网盘下载》
这篇博客参考了Github知名开源平台,AI技术平台以及相关领域专家:Datawhale,ApacheCN,AI有道和黄海广博士等
约有近100G相关资料
,希望能帮助到所有小伙伴们。