k-均值聚类算法 Primary
k-均值聚类算法(英文:k-means clustering)
定义:
k-均值聚类算法的目的是:把n个点(可以是样本的一次观察或一个实例)划分到k个聚类中,使得每个点都属于离他最近的均值(此即聚类中心)对应的聚类,以之作为聚类的标准。
案例——区分好坏苹果(有Key)
import matplotlib.pyplot as plt
from sklearn.cluster import KMeans
import numpy as np

# 生成随机样本数据
# 假设你采集数据是二维的,每个样本有两个特征  [光泽, 气味]
appleData = np.array([[44, 40], [60, 45], [59, 70], [65, 80], [50, 50],
                      [75, 65], [45, 52], [64, 75], [65, 70], [53, 45]])

# 将样本分成2类 : 好果、坏果
# 设置两个初始簇中心的位置,指定Key值
initial_centroids = np.array([[40, 20], [70, 80]])

# 创建KMeans对象,并指定初始簇中心位置
kmeans = KMeans(n_clusters=2, init=initial_centroids)
kmeans.fit(appleData)

# 获取每个样本的类别
labels = kmeans.labels_

# 提取聚类中心
centroids = kmeans.cluster_centers_

# 绘制散点图并着色
colors = ['g', 'r']
for i in range(len(appleData)):
    plt.scatter(appleData[i][0], appleData[i][1], color=colors[labels[i]])

# 绘制聚类中心
for c in centroids:
    plt.scatter(c[0], c[1], marker='x', s=150, linewidths=5, zorder=10)

# 添加标签和标题
plt.xlabel('Glossiness')
plt.ylabel('Smell')
plt.title('Apple glossiness and smell K-Means clustering results')

# 显示图形
plt.show()
show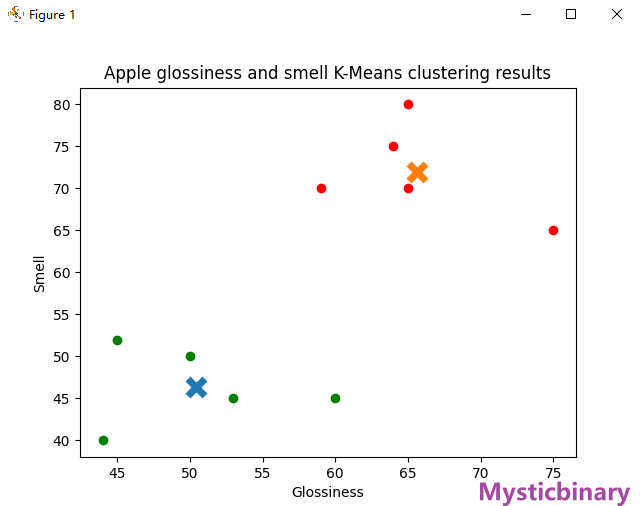
案例——自动聚类(无Key)
import matplotlib.pyplot as plt
from sklearn.cluster import KMeans
import numpy as np

# 生成随机样本数据
X = np.array([[60, 75], [59, 70], [65, 80], [80, 90], [75, 65],
              [62, 75], [58, 68], [52, 60], [90, 85], [85, 90],
              [70, 75], [65, 70], [55, 65], [75, 80], [80, 85],
              [65, 75], [60, 70], [55, 60], [95, 95], [90, 90]])

# 将样本分成3类
kmeans = KMeans(n_clusters=3)
kmeans.fit(X)

# 获取每个样本的类别
labels = kmeans.labels_

# 提取聚类中心
centroids = kmeans.cluster_centers_

# 绘制散点图并着色
colors = ['r', 'g', 'b']
for i in range(len(X)):
    plt.scatter(X[i][0], X[i][1], color=colors[labels[i]])

# 绘制聚类中心
for c in centroids:
    plt.scatter(c[0], c[1], marker='x', s=150, linewidths=5, zorder=10)

# 添加标签和标题
plt.xlabel('Glossiness')
plt.ylabel('Smell')
plt.title('Apple glossiness and smell K-Means clustering results')

# 显示图形
plt.show()
show